
I've had this on the back burner for some time but I've decided its definitely worth posting about. This is a good one for infographic and/or history nerds.
Most people know who Napoléon Bonaparte was, a French military and political leader who rose in stature to become commander of the most powerful army in Europe at the time. Many people would also know that at the peak of his power, in 1812, he decided to invade Russia. This was a disastrous campaign that resulted in the humiliating defeat of his army and the loss of hundreds of thousands of French lives.
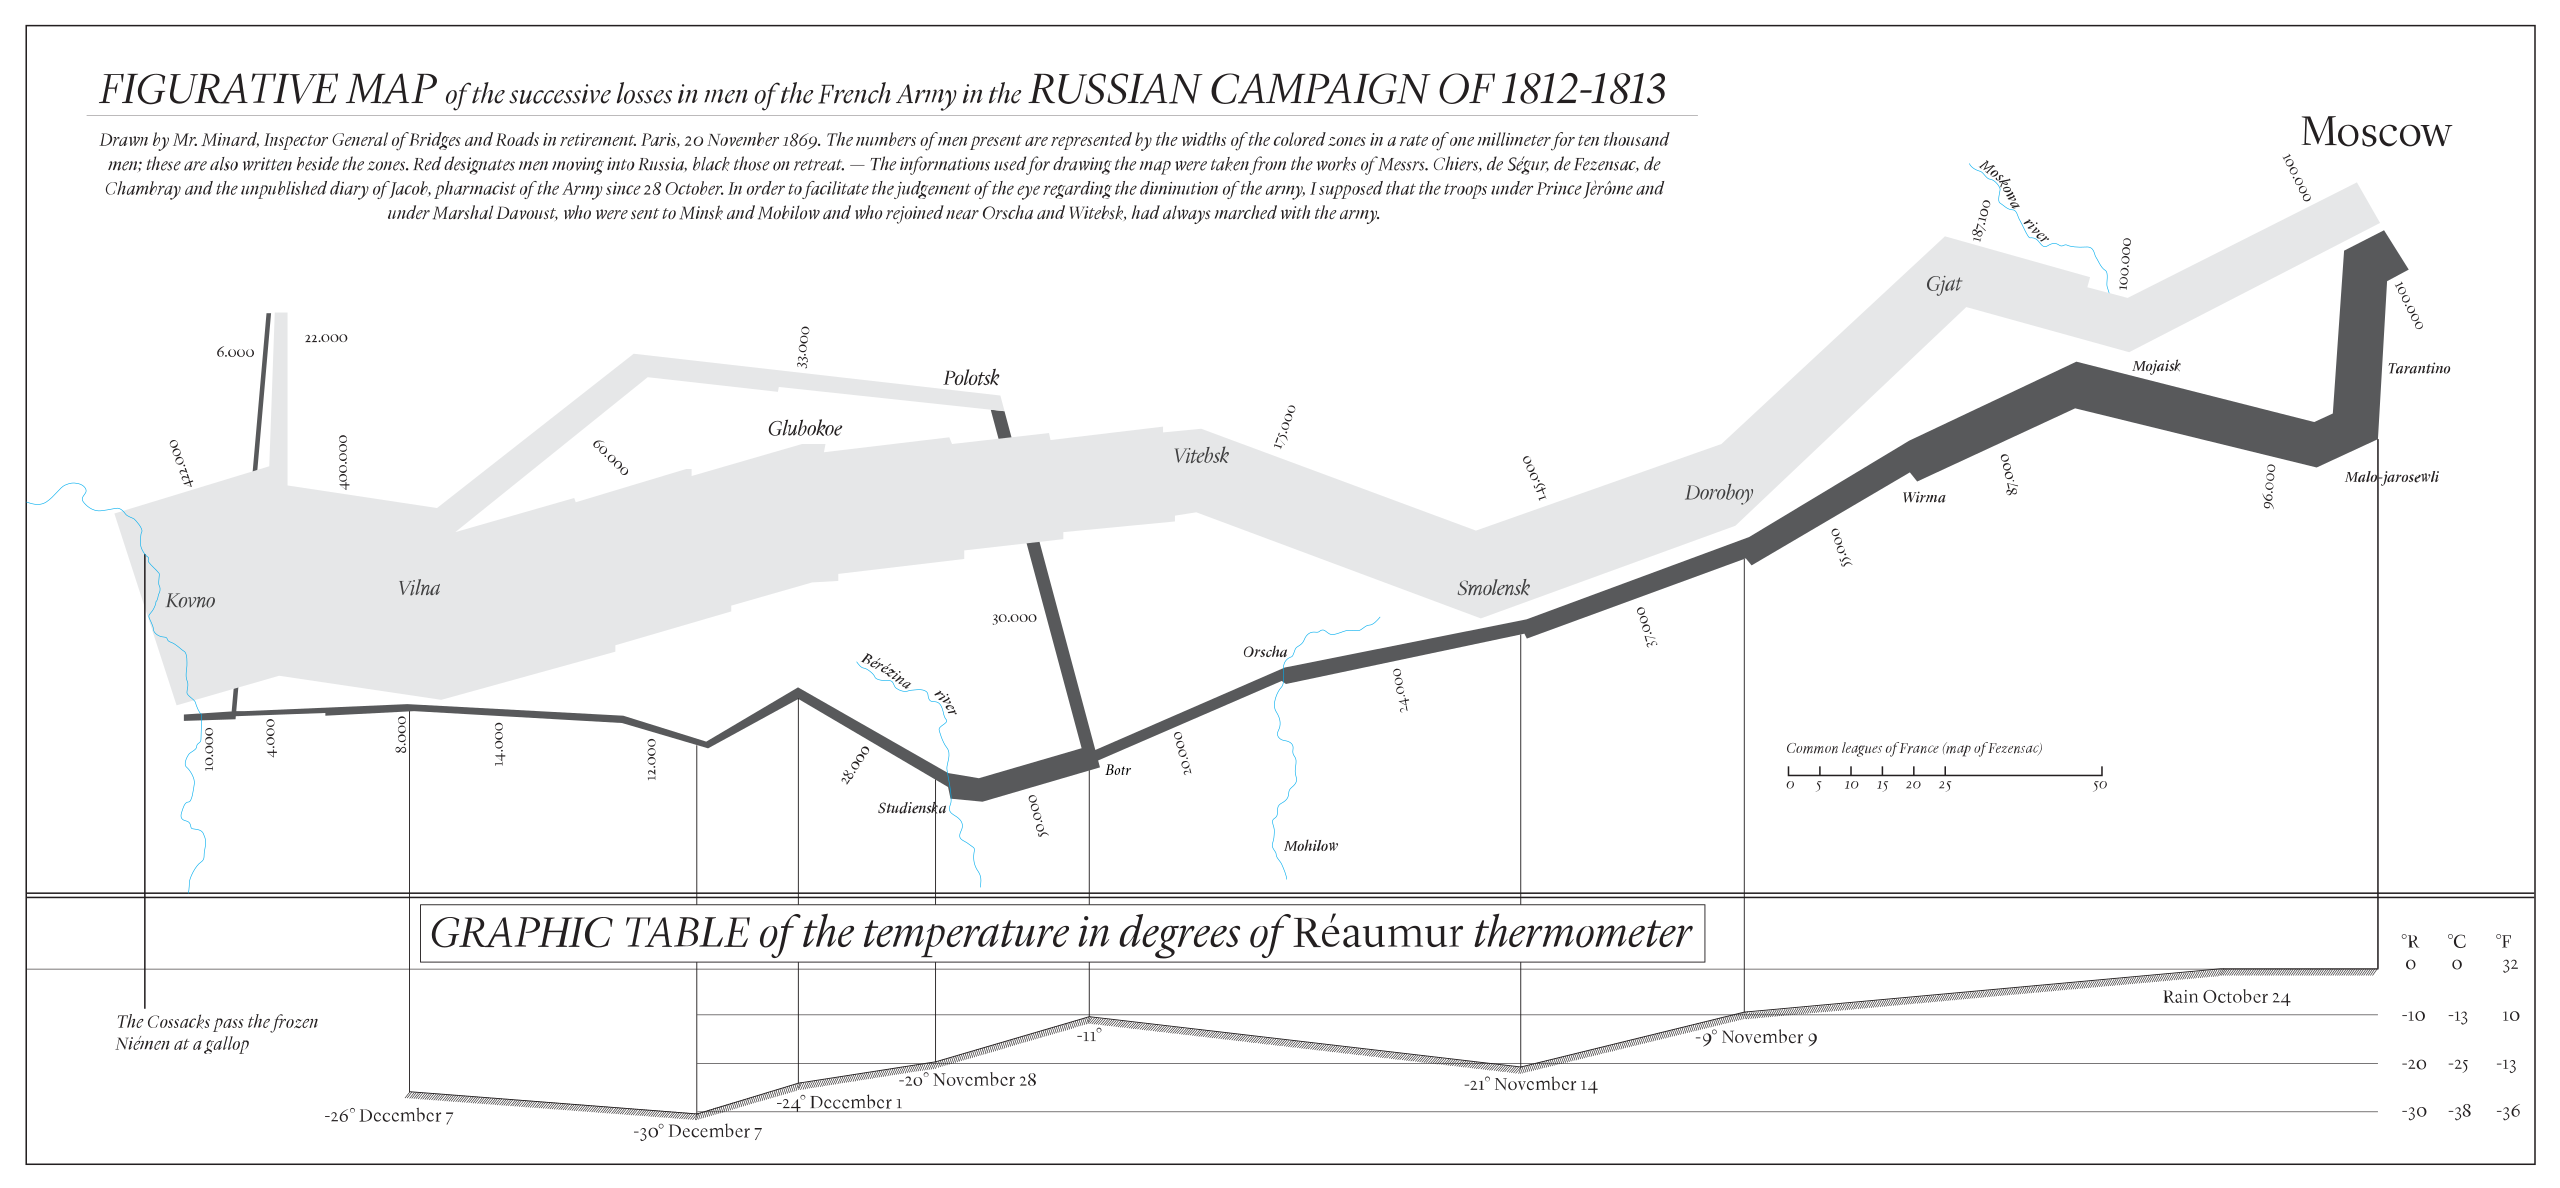
In 1869, Charles Joseph Minard a French civil engineer, produced an infographic showing Napoleon's advance and retreat from Russia. The infographic has become well known and is considered one of the best examples of infographic due to its ability to succinctly display many data points: the advance and retreat of the army (brown and black lines), the size of the army (line thickness), geographical location (using a map of the region), direction of the army's travel including points where the army split or re-joined, the relative temperature (using a line graph) and key dates (next to the temperatures).

An English version of the infographic can be seen here. I first read about this infographic at socks where you can read a more detailed breakdown of the infographic and the history of the Russian campaign.
If you're interested in the Napoleonic wars, I recommend the Richard Sharpe series of historical fiction by Bernard Cornwell. The main character is a soldier in the British army where he takes part in many battles with Napoléon's armies.
Comments are closed, but trackbacks and pingbacks are open.